Monitor your requests easily with Laravel Telescope.

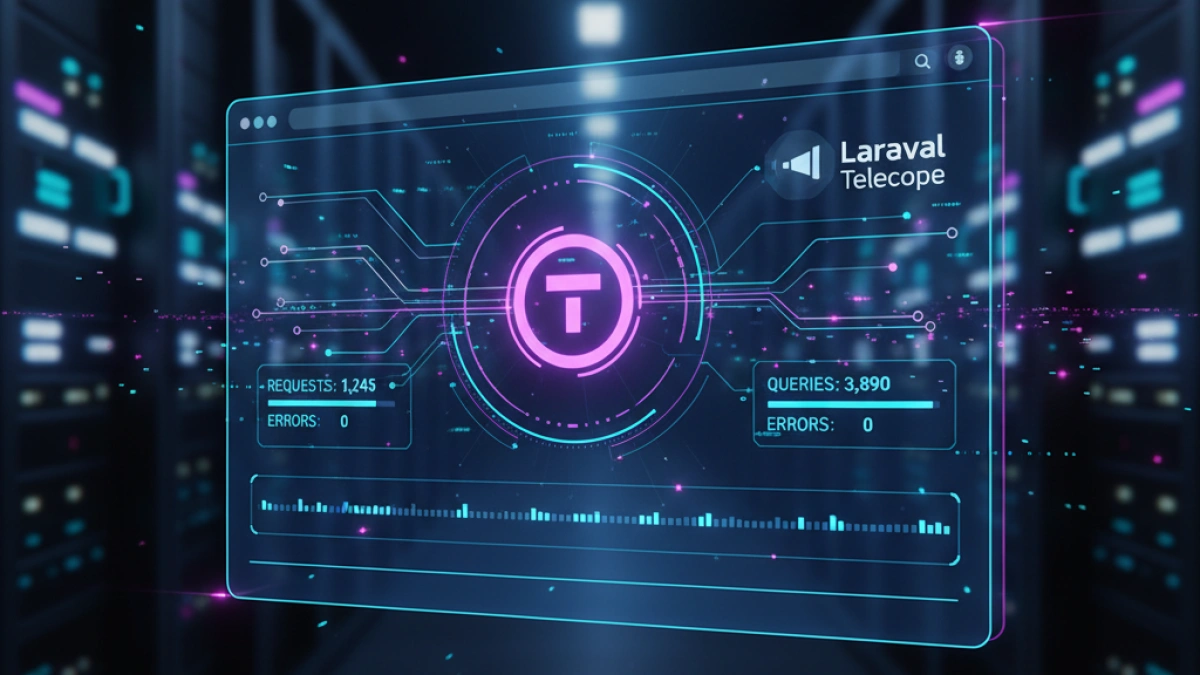
Laravel Telescope is a tool that allows web application developers to monitor and debug requests in real-time in a simple and effective manner. This article explores how to use Laravel Telescope to optimize request monitoring in your applications, making it easier to identify issues and analyze performance.
What is Laravel Telescope?
Laravel Telescope is a debugging assistant for applications built with the Laravel framework. This tool easily integrates into your projects and provides a visual interface where important details about each request coming into the application can be observed. Telescope takes care of collecting and displaying relevant information, such as exceptions, database queries, events, and much more.
Installing Laravel Telescope
Installing Laravel Telescope is a straightforward process. First, you need to ensure that your Laravel environment is correctly set up. Then, you can perform the installation using Composer. Simply run the following command in your terminal:
composer require laravel/telescopeAfter the installation, make sure to publish the Telescope assets by running:
Read also


php artisan telescope:installThis will create the necessary configurations and migrate the required tables in your database.
Configuration and Usage
Once Telescope is installed, you can access the interface via the /telescope route. By default, only authenticated users with the appropriate permissions can access the interface, ensuring the security of your data.
In the Telescope interface, you'll observe different tabs detailing various aspects of the requests. Some of the most useful sections include:
Read also

Requests
In the Requests section, you will see a list of all the HTTP requests that your application has received. Each entry provides information such as the requested URL, the HTTP method used, and the status of the response. This tool is especially useful for tracking errors and monitoring user activities.
Queries
The Queries tab displays all the interactions with the database that occur through your application. You will be able to identify which queries are taking longer and optimize them as needed. This is essential for improving your application's performance, especially when you start handling significant volumes of data.
Exceptions
In the Exceptions section, you can monitor any errors that occur within your application. Telescope logs each thrown exception in detail, making diagnosis and troubleshooting easier. With this information, you can access error messages, stack traces, and more, streamlining the debugging process.
Jobs and Events
Finally, Telescope also provides a view of jobs and events that are running in your application. This allows you to monitor background tasks and events that may impact the overall performance of your application.
Conclusion
Laravel Telescope is a powerful tool that simplifies the monitoring and debugging of applications built with Laravel. Its user-friendly interface and detailed logging capabilities make identifying and resolving issues much more accessible for developers.
If you're looking to improve your application's quality and optimize its performance, Laravel Telescope is the ideal solution!
I invite you to read more related news on my blog to continue learning about development with Laravel and other useful tools.