Master advanced techniques for debugging queries in Laravel 10.


Laravel 10 has revolutionized the way developers manage their applications, offering a robust and flexible framework. However, like in any development environment, it is often necessary to debug queries to optimize performance and ensure efficiency. In this article, we will explore various advanced techniques that will allow you to effectively debug queries in Laravel 10.
Introduction to Query Debugging in Laravel 10
Query debugging is a fundamental aspect of development in Laravel. Understanding how SQL queries are executed and how to debug them can make a significant difference in your application's performance. Laravel provides multiple tools and techniques that facilitate this process, from built-in options to additional packages that enhance query tracking capabilities.
Using the Query Log
One of the most useful tools in Laravel for debugging queries is the query log. This log allows you to see all the SQL queries executed during a request. You can enable the query log using the following command:
\DB::listen(function ($query) {
    \Log::info($query->sql, $query->bindings);
});
By implementing this, each time a query is executed, it will be logged in your application’s logs, allowing you to identify slow or inefficient queries.
Read also
Enabling Debug Mode
Another valuable technique is to enable debug mode in Laravel. By activating this option in the .env file, the framework will display detailed information about the executed queries, routes, and errors. To enable debug mode, simply change the value of APP_DEBUG to true:
APP_DEBUG=true
This will provide you with a clearer view of what is happening inside your application while performing tests.
Using Third-Party Tools
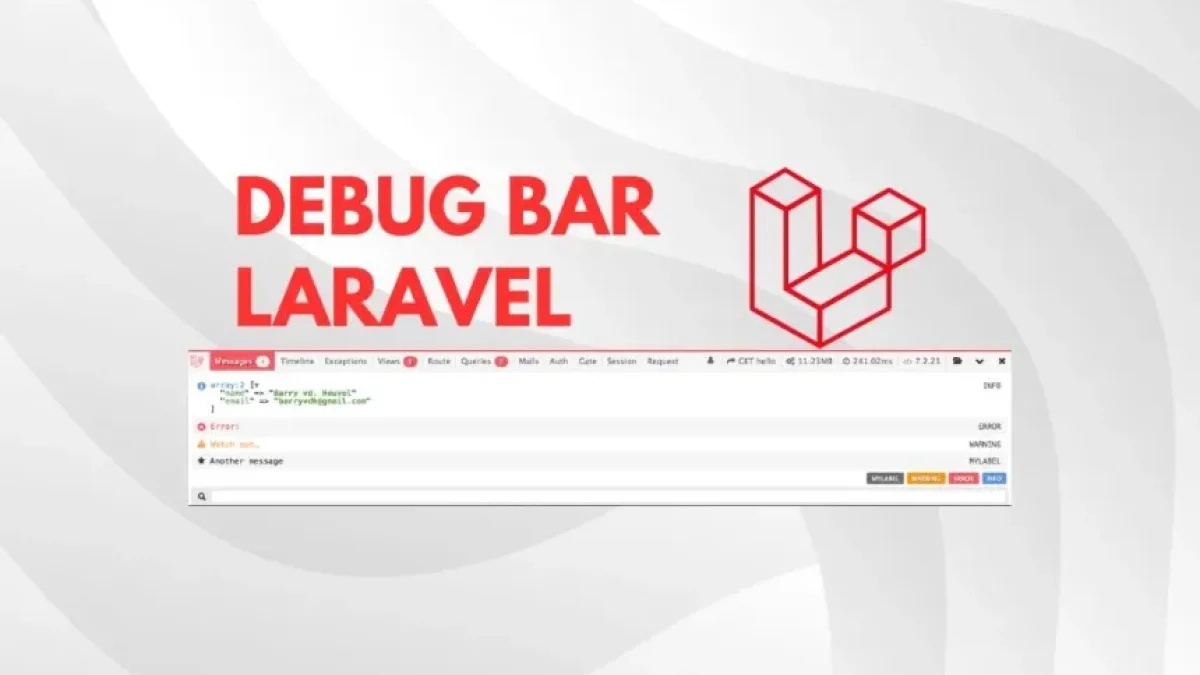
For those looking for a robust solution, there are numerous third-party tools that can facilitate query debugging in Laravel. For example, Laravel Debugbar is a popular package that adds a debugging bar to the user interface. This bar shows information about executed queries, load times, and other parameters of interest, all in real-time.
Read also
To install Laravel Debugbar, simply run the following command:
composer require barryvdh/laravel-debugbar --dev
Once installed, you will be able to see all relevant data in the toolbar that appears at the bottom of your page, making it easier to identify issues.
Analyzing Specific Queries
In addition to the mentioned tools, Laravel also offers the DB::enableQueryLog and DB::getQueryLog functions to analyze specific queries. You can enable query logging and then obtain a summary anywhere in your code:
\DB::enableQueryLog();
// ... your queries here ...
$queries = \DB::getQueryLog();
This approach is useful for focusing on specific sections of your code instead of reviewing the entire log.
Optimizing Queries
Finally, it’s essential to mention that, in addition to debugging, optimizing queries is also crucial. Using methods such as pagination, select with specific columns, and eager loading to reduce database load can make a significant difference in your application's overall performance.
Conclusion
Mastering advanced techniques for debugging queries in Laravel 10 is crucial for any developer looking to enhance their application's performance. From the use of query logs and debug mode to the implementation of third-party tools, there are a variety of methods at your disposal.
I encourage you to keep exploring and learning more about development in Laravel and other related topics on my blog. Don't miss out!


