Little-Known Features of Laravel Debugbar You Should Try


Laravel Debugbar is a powerful tool for developers looking to optimize the performance of their Laravel applications. While many are already familiar with its basic functions, there are lesser-known features that can take your debugging skills to the next level. In this article, we will explore some of these aspects that you may not have discovered yet.
Integration with Laravel
What is Laravel Debugbar?
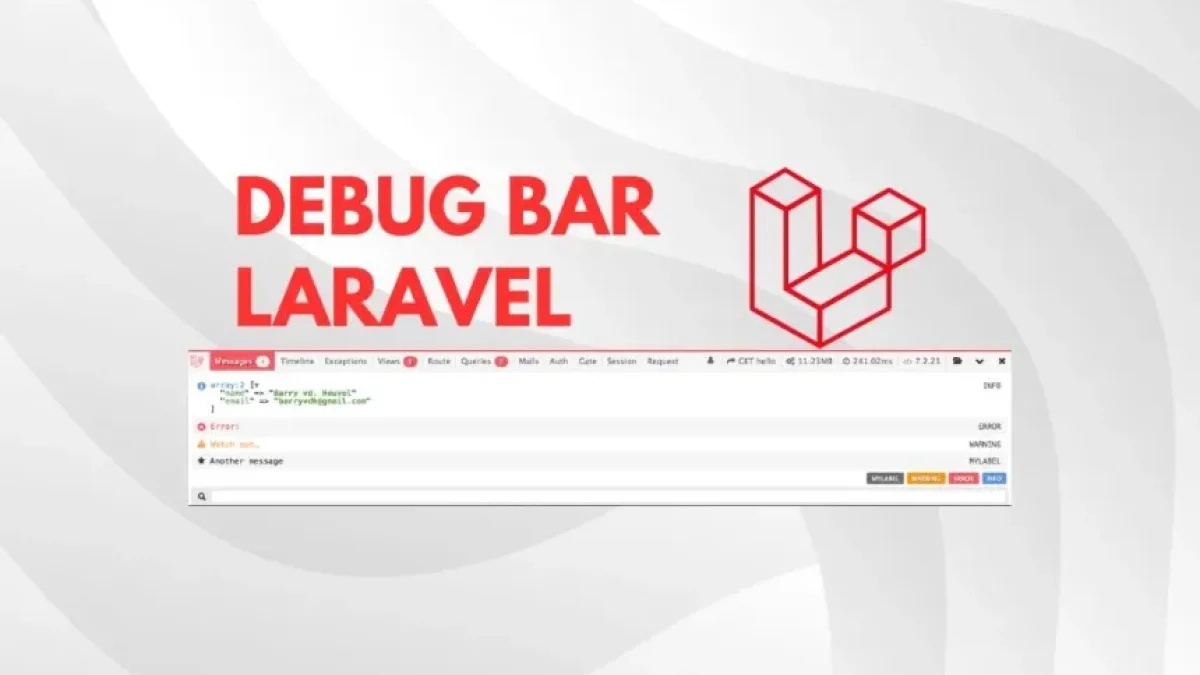
Laravel Debugbar is a package that provides a debugging toolbar for Laravel applications. Its purpose is to facilitate the identification of issues and improve performance during development. In addition to displaying information about database queries, it helps track the memory used by the application and provides details about the rendered routes and views.
Simple Installation
Installing Debugbar is very straightforward. You just need to add the package to your project using Composer. Simply run the following command in your terminal:
composer require barryvdh/laravel-debugbar --dev
Once installed, Debugbar automatically integrates into your application, providing useful information on each page load.
Read also
Featured Characteristics
Query Tracking
One of the most useful features is SQL query tracking. Debugbar not only shows the queries that are executed but also their execution time and the total number of queries made. This is invaluable for identifying and optimizing performance bottlenecks in your application.
Execution Time Information
Debugbar allows you to measure the total time taken to process a request. This includes execution times for middleware, controllers, and views. This information is presented clearly, helping developers identify areas that require optimization.
Log Recording
Another interesting feature is the ability to display the logs generated by Laravel. This includes error messages, warnings, and information. You can access these logs directly from the debug bar, making it easier to identify issues without having to navigate to different files.
Read also
Session Variables
Debugbar also provides access to session variables. You can view the data stored in the session in real time, which helps you better understand the state of the application during debugging.
Route Information
The tool allows you to see details about the routes that have been registered in the application. This includes information such as the route name, applicable middleware, and other parameters, which is useful when verifying that the route configuration is correct.
Additional Features
Symfony Information
Laravel Debugbar is based on the Symfony Debugbar package. This means it also has access to many additional features. For example, you can enable event tracking and see how they occur in your application. This feature is useful for verifying that events are being triggered correctly.
Integration with FirePHP
The tool also allows for optional integration with FirePHP, giving you the ability to send debugging data directly to the browser. This feature can be especially useful if you are working with multiple applications and need debugging data without overwhelming the browser interface.
Conclusions
Laravel Debugbar is an essential tool for any developer working with the Laravel framework. Its lesser-known features, such as query tracking, log recording, and visibility of session variables, make debugging more efficient and effective.
I encourage you to explore all these functions in your next project and discover how they can enhance your development experience. For more articles and tips on Laravel and other tools, feel free to visit my blog. Until next time!


